
Building Better Tables: An Exploration of Custom Probability Matrices
Programming the Chaos: How to Shape Your Game's Outcomes

Welcome back everyone, appreciate you coming in and taking a seat. I hope you’ve had an amazing week, but we all know that’s not always possible; and that’s okay. We can let the crappy parts of life drag us down, or make us more resilient and capable. Yes you have choice in how you react.
Suffering is inevitable, however, suffering can also be quite liberating if you choose to change the way you react. For example, let’s say you’re rolling for an encounter (used as a Sum Matrix) one of my new fangled tables I just developed and the result is one of the outer values; uncommon encounters are extra tricky and often require extra effort.
Moments like these are opportunities for some creative fun. Both in real life and at the table. If you’ve already landed in a rough spot, you might as well experiment with what’s possible. You’re on the outer edges and likely getting ready to fall off regardless of the outcome. Incoming is the ending of something old and the start of something new, for example if you rolled on the Outcomes table (used as a Probability Matrix). Certainly a good time to have some fun with your experience.
But first, let me explain what all this is, so it makes sense. As you know I’m obsessed with bell curves. I’m also obsessed with tables, matrix tables for example. Similar to the ones you may have used in school to learn multiplication for example, sometimes they are different shapes and more abstract.
Note that (below) I’ve created a table to represent a 2d6 bell curve. You’ll know it’s a curve because you can see, that 7, the value with the highest chance of occurrence, takes up more boxes than any other value. Go ahead and count, I’ll wait here…
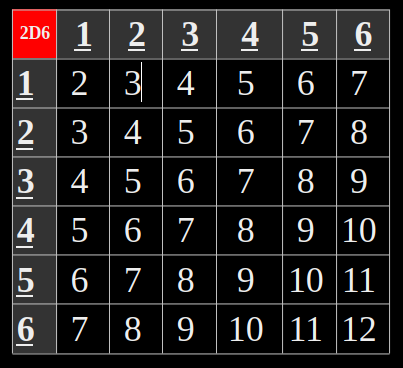
Rather I’ll wait down here; but you can see that certain values have a greater occurrence chance than, and others have a lesser chance of being rolled, like with the outer values.
This means, that there are more combinations of 2d6 - two, six sided dice rolled together, that add up to 6, 7 and 8 so you’ll hit these results more often than say, 5,4,2 and 9,10, and 12.
However, this week I’m exploring lots of different ways to explore these tables as if they were maps. Sometimes abstract maps, other times specific maps, and not always maps that represent physical locations.
Take a look at this ‘Heat Matrix’ for example:
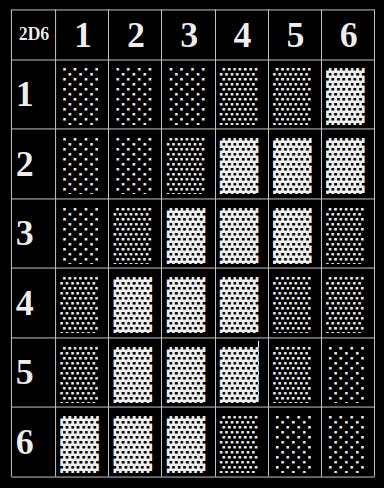
▓ (Light): Sums 6, 7, 8 (highest probability: ~14–17% each).
▒ (Medium): Sums 5, 9 (~11% each).
░ (Dark): Sums 2, 3, 4, 10, 11, 12 (~3–8% each).
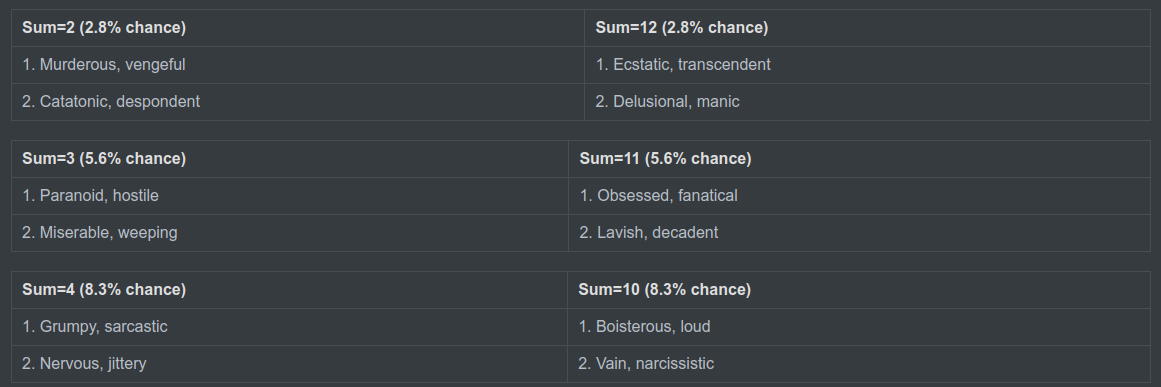
This is just another visual example for you, but it’s also a good example of a useful table. Imagine how many things you could track with such a thing? How about the mood of an NPC? Let’s say the higher trafficked areas are more common expected moods, and the further you get out from there, the more you’ll find greater or lesser degrees of the standard.
There are six opportunities to land on a average range of moods that cover, let’s say a d4 range.
Here’s a mood spectrum tailored to the 2d6 bell curve, with escalating intensity as results move toward extremes (2 or 12). Each common result (6–8) has a d4 mood table, while rarer results use smaller dice (d3 or d2) for more extreme moods.
Mood Tables for 2d6 Results
(Aligned with probability heat map)
Common Results (▓ Bright Cells: 6, 7, 8)
Base Mood: Neutral → Positive Mechanic: Roll 1d4 for nuanced variations.
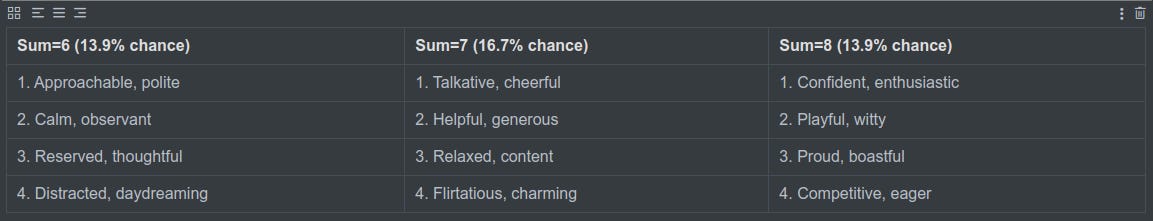
Uncommon Results (▒ Medium Cells: 5, 9)
Base Mood: Moderately Positive/Negative Mechanic: Roll 1d3 for stronger shifts.
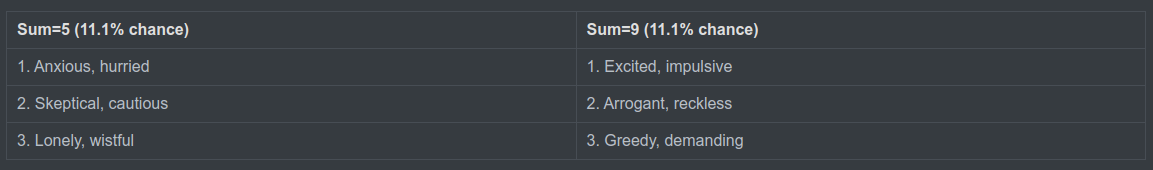
Rare Results (░ Dark Cells: 2–4, 10–12)
Base Mood: Extreme (Negative or Positive) Mechanic: Roll 1d2 for high-stakes moods.
Of course you don’t have to use the heat map, you can fill the table with numerical values if you prefer. I just wanted to show off the cool heat map I made.
But there you go, a simple way to check the mood when encountering an NPC, and just an example I came up with off the top of my head to get things rolling. But it works and closely mimics reality don’t you think?
Imagine if all the universe has been doing was rolling dice this whole time; you and I simply a vibration of a rolled result from a 2d6. An echo of a result rippling for a brief moment in space. If that’s all this is, then we might as well have some fun while we’re here, don’t you think? Stop taking everything so serious and instead make room for something better.
There’s something spooky and exciting in the idea that each of us is just a fleeting moment. In a way it means we’re free to be whatever we want without consequence; but it also means that something about us is also temporary.
One moment we’re here, the next, we’re on a different portion of my cool heat map with a whole different, but somehow familiar perspective. Which means that we can use this same concept, only in a different form.
And form should be the focus here, because it’s the foundation we use for each table, even if it’s not traditionally square.
For example, my rather overly complicated Town Fabrication Machine, which I’m still working on improving. In this case, there are tables built into one table in an triangular shape that are then connected with a path that loops back around to itself.
We wont be do anything that ridiculous, here, but it’s an example of a programmed hex flower, and it used bell curves to help you build a town from scratch. It also has a counterpart that’s been replaced and simplified that populates the town with NPC’s and fills the shops with items. I’ll publish that soon, part of it was already published recently.
But none of that is really why I brought you here… I actually want to explore the idea of making customized tables.
Programming Tables
Alright, so programming isn’t really the right word, but it’s pretty close. When we program a table we’re telling the universe to give us certain results over others using a numerical language. When run (roll) the program produces results via data tables were the end user looks up the value and equates to a particular data.
That’s a long winded way saying, roll 2d6 and look up the results on the table, then take that result and look up what it means on the list below.
I’d like to mention again, that dice rolls are not perfect and the universe is chaotic and seemingly random until you start trying to catch it off guard. As soon as you’re looking things behave rather normally. It’s when we’re not paying attention we run into trouble and things tend to act in a more random and unexpected fashion. That being said, it’s not a perfect method and not guaranteed to give certain results. However, the probability is quite higher, and that’s an edge over the chaos.
And we get that edge by programming, by tuning our tables. Up until this point we’ve only explored lower values as negative, higher as positive and the more common results as normal, and or expected. We can shift that however we like; for example if the game your playing is prone to instability we could simply make the hotter center reflect more negative conditions and the outer, cooler spots the more positive outcomes.
You are more than welcome to try this manually if you like, it’s good for your brain and quite simple. However, I made it far more complicated for myself and wrote a python script to do it for you, even if you don’t know how to program. All you need to do is input the wanted results (up to 3 per cell) and it will output a table with your desired results.
And you can do it online for free. Just copy, paste, run and answer the prompts. But before we get into that, lets look at some example tables:
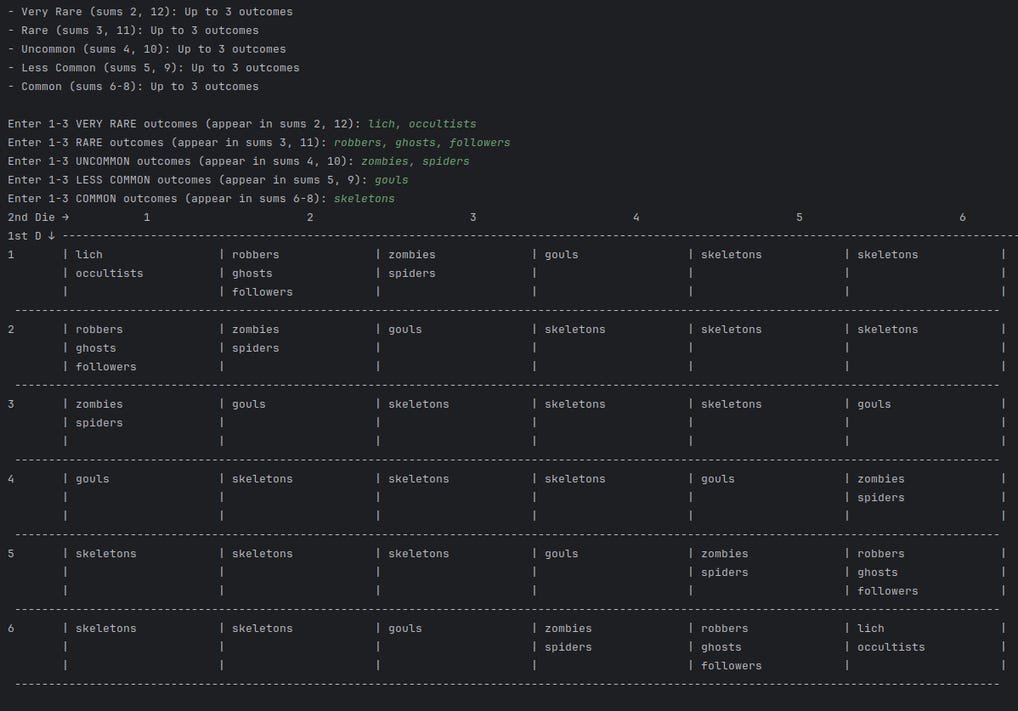
Lets say you’ve stumbled upon a tomb, you stick you head into the darkness and listen… Sure enough, you can hear sound of the dead wandering about in the depths of this place, afraid to step out into the day light. You think yourself, ‘it’s getting late, but I don’t want to camp too far away from this place since it’s locations changes so often…’ You decide to go in and clean out the some of the early interior before it gets too dark. That way you can camp just inside the walls; and if the location changes, at least you’ll go with it.
Using the table above, the rarest encounters will include things like a the lich who dwells in this space, and an occasional occultist who worship them. Robbers, the ghosts of the long deceased who’ve perhaps been robbed and now wander these halls looking thieves, along with some new members of the cult sent out to prove themselves worthy are rare. Zombies and Spiders are slightly more common, with a 17% chance of appearing, and finally the less common but quite frequent ghouls, and skeletons being taking up the bulk of the tombs encounters.
Outcomes are distributed by probability zone:
- Very Rare: sums 2, 12
- Rare: sums 3, 11
- Uncommon: sums 4, 10
- Less Common: sums 5, 9
- Common: sums 6,7,8
Outcome Probabilities:
Very, Rare: 5.56%
RARE: 11.11%
Uncommon: 16.67%
Less Common: 22.22%
Common: 44.44%
Keep in mind those are the ratios I am using in my script, and manual tables. Feel free to adjust as needed to suit your needs. I find this formula works quite well. But it is also possible to split some of the larger values if you want to. For example, Uncommon, with 4 and 10. The 4 could represent something opposite or slightly different than the 10. In this way you’ve created a 8% (8.33) chance of either a 4 or a 10 result, and you can further split Common three ways, breaking down into 11% (11.11) chance.
And naturally, if it’s not obvious, you can layer in a small slice by splitting the Very Rare values for a nice 3% (2.68) chance.
This can be done by using a comma to separate values (up to three!) for each of the five input chances.
Frequency of encounters is of course up to you. Or you can create a table that you can roll on based on the frequency you want to use. You can make encounters super rare (11%) , or really common (45%+) or anywhere in between.
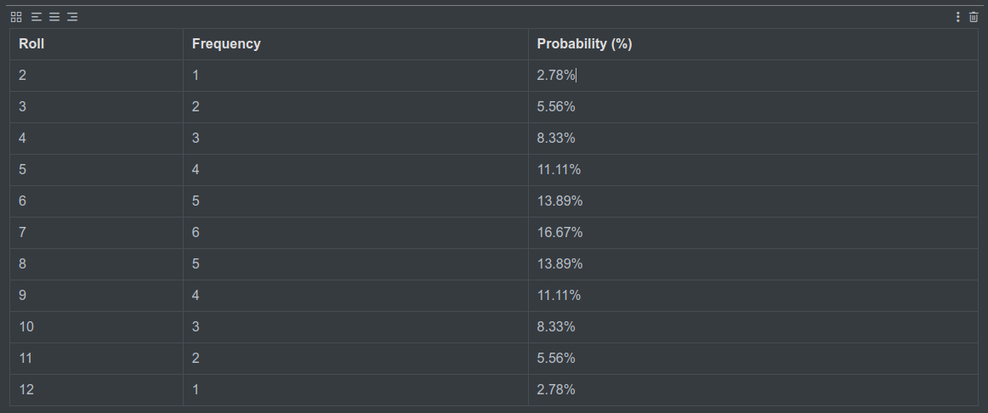
Above you can see the probability of rolling any particular value. Use is as a means of developing your own unique tables and probabilities.
Programmed Encounter Table:
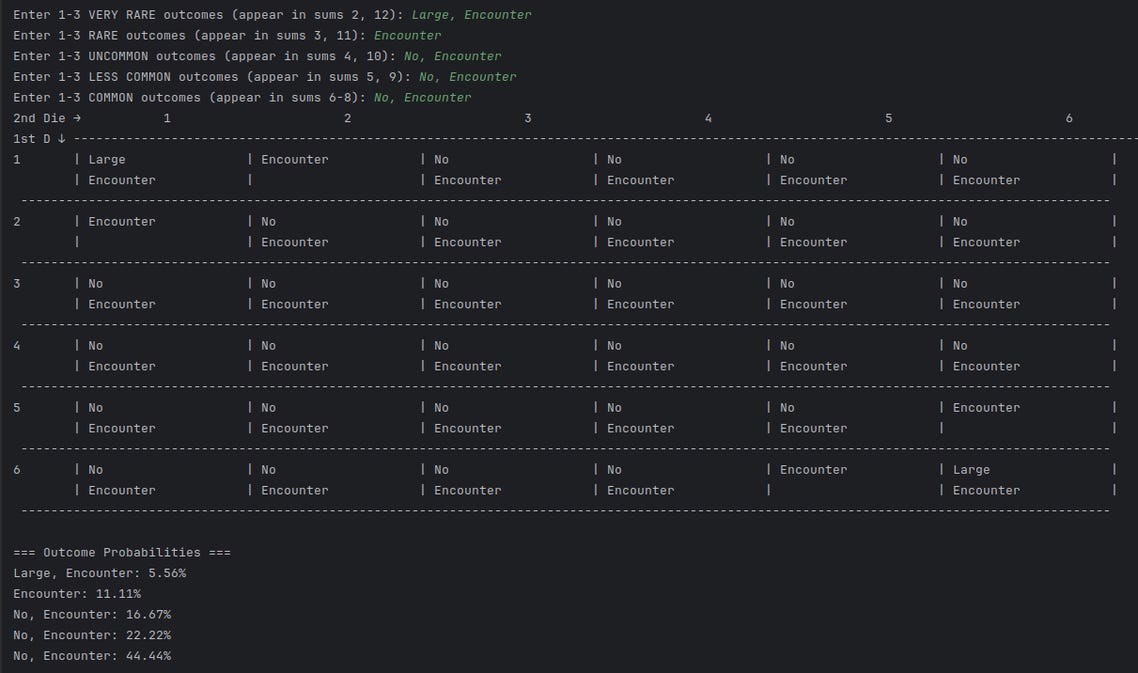
Above, an encounter table that gives a 17% (5.56 + 11.11 = 16.67) chance of an encounter. Which is a 1 in 6 chance of an encounter. So why not just roll a d6? Because that’s boring! That’s why…
Seriously though, you could if you wanted. But it wouldn’t be as accurate; as compared to what I hear you asking? Stop asking questions. It’s getting late and close to publishing time…
The "Why Not Just d6?" Problem
First of all, as I said, it’s Boring. A flat 1 in 6 lacks narrative tension or mechanical depth, it lacks customization. Further, there’s no nuance. All encounters feel equally likely to occur. There’s no rare vs. common encounters, events, rare items, towns (if you use it as a map), narrative injection, etc, etc, etc,.
Add Narrative Weight
Pair the mechanic with Tension Dice: Increment a die size (d4 → d6 → d8) as danger grows. This can be done in the script itself rather easily. Let me know if you need help.
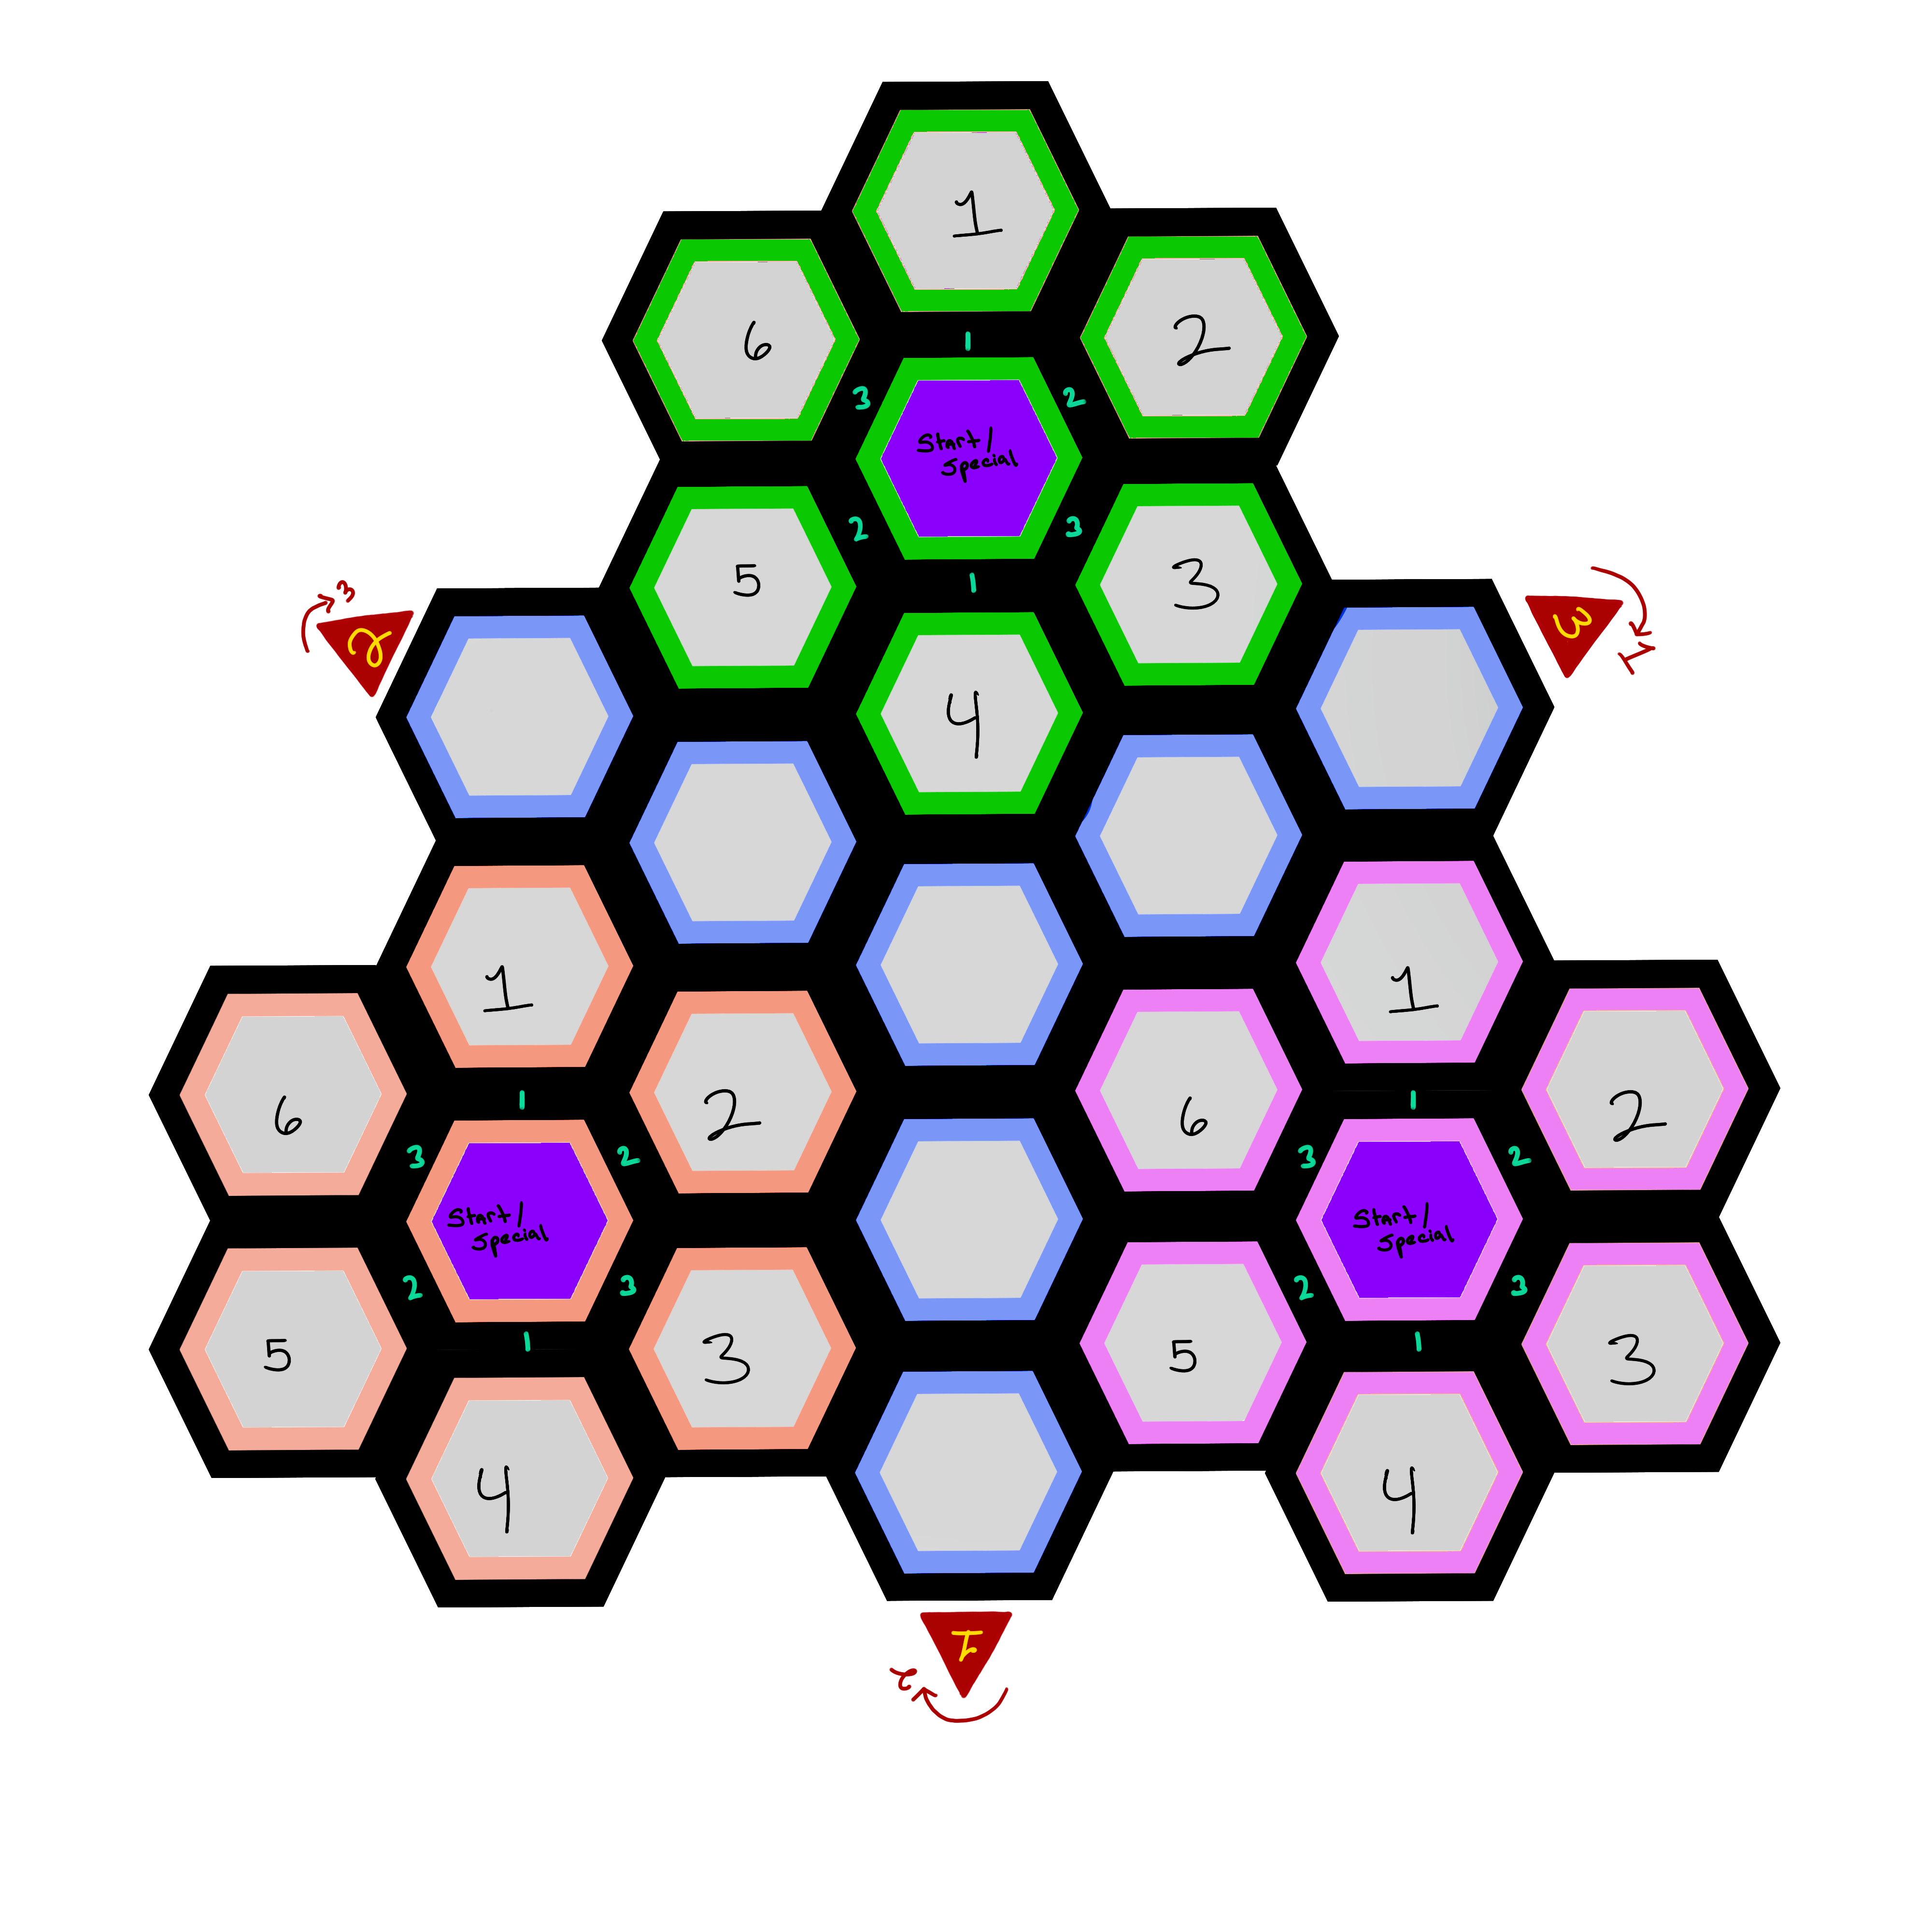
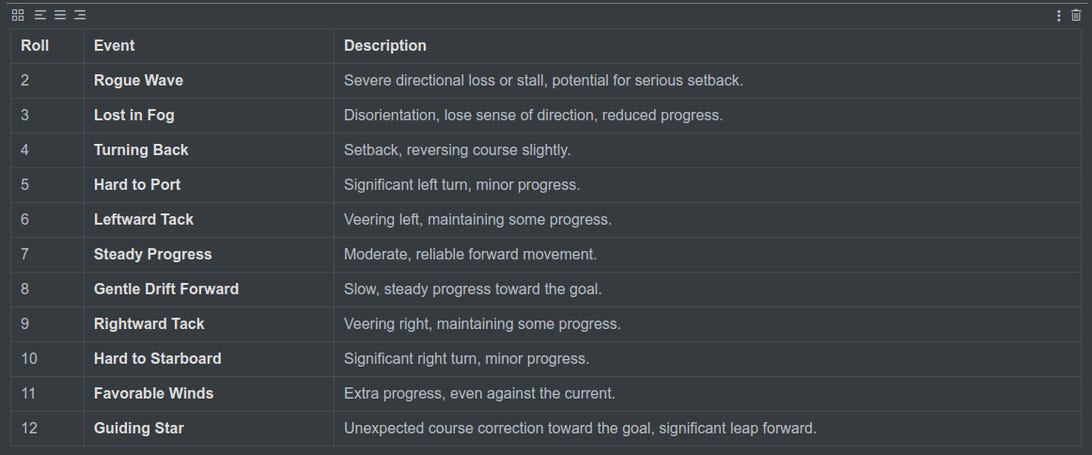
Let’s dive a bit deeper down this rabbit hole and work out a navigation table shall we? Let’s say we need to take a boat to a remote location, having been tasked with locating a lost scholar. They left some months ago in search of the grimoire of Mors Mala, aka the Book of Evil Death.
You’ve no clue where this place might be, but the captain of the boat, being a man of the world knows the exact location. In fact he’s the one who took the scholar there not three or so months ago. You can mimic the captain navigating the boat to the location abstractly using a Programmed Navigation Table.
You see what I just did there? I made a new thing out of nowhere. You can too. It’s really simple. I used Sailing lingo to look cool, but to be honest I had to check some of my games to be sure I was using the words correctly. I worked it out so that most of the time, we’re moving forward
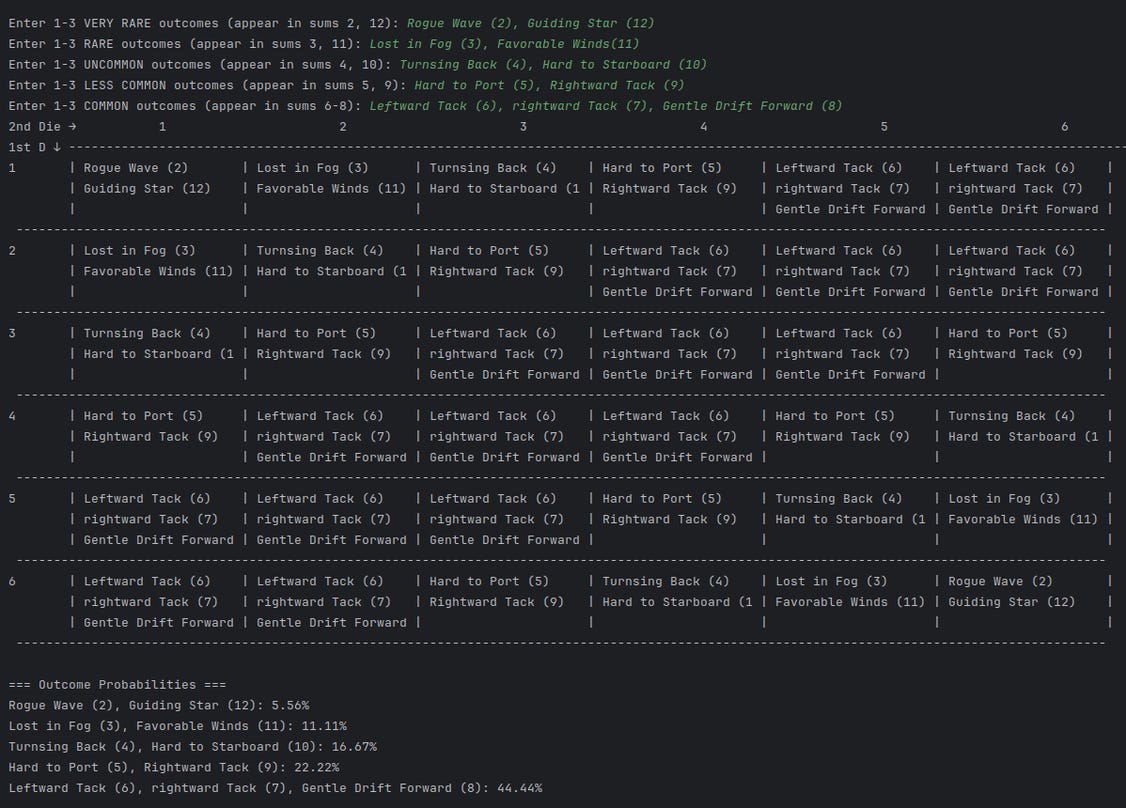
My input as seen in green on the Navigation table, listed below, showing the chance of each event occurring.
As you can see I split everything up, giving nearly each value it’s own outcome, with it’s own chance of happening. Rolling on this table allows you to mimic the movement of a ship towards an abstract location. How many steps is up to you. I left out the possibility of a final destination because I’d rather work that out myself. Sometimes I don’t mind a long voyage, other times it can get a bit boring and I feel like it’s time to head towards land.
Anyway, just a few of the many possible ways to explore this idea of programmable tables. I’d love to show you more examples, but it’s a getting late.
Below is the script, if you have any questions feel free to ask. You can run it for free at Online Python. Simply follow these steps:
Step 1: Copy the Script Below
Highlight the entire script, then right-click and select Copy (or press Ctrl+C / Cmd+C on your keyboard).
Step 2: Open the Online Python Interpreter
Go to Online Python Interpreter in your web browser. You should see a code editor with a blank space for entering your Python code. If it’s not blank, erase everything that’s there.
Step 3: Paste the Script into the Editor
Click inside the code editor, then right-click and select Paste (or press Ctrl+V / Cmd+V on your keyboard) to add the script you copied.
Step 4: Run the Script
Click the Run button at the top of the page, or press Ctrl+Enter / Cmd+Enter on your keyboard.
Step 5: Provide Any Required User Inputs
Finally, enter the values you’d like to use, up to three per line, separated by comma’s. Press enter, then enter the next set of values you’d like to use for each, keeping in mind the chances of them triggering.
Copy and paste table, take a screen shot, or whatever you like. If there is a real need, and you can run python on your computer, I can add a quick, table to PDF feature.
def get_user_input(prompt):
    try:
        # Ensure the input call is straightforward for environments that support it
        return [v.strip() for v in input(prompt).strip().split(",") if v.strip()]
    except (OSError, EOFError) as e:
        print(f"ERROR: Unable to read input. {e}")
        return []


def get_zone(total):
    """Determine probability zone for a given sum"""
    if total in [2, 12]:  # Very Rare (2.8%)
        return "very_rare"
    elif total in [3, 11]:  # Rare (5.6%)
        return "rare"
    elif total in [4, 10]:  # Uncommon (8.3%)
        return "uncommon"
    elif total in [5, 9]:  # Less common (11.1%)
        return "less_common"
    else:  # Common (13.9%-16.7%)
        return "common"


def generate_table(very_rare_outcomes, rare_outcomes, uncommon_outcomes, less_common_outcomes, common_outcomes):
    max_outcomes = max(len(very_rare_outcomes), len(rare_outcomes), len(uncommon_outcomes), len(less_common_outcomes), len(common_outcomes))

    # Corrected header alignment
    header = "2nd Die →" + "".join([f"{i:^24}" for i in range(1, 7)])
    print(header)
    print("1st D ↓ " + "-" * (24 * 6 + 1))

    # Track zone counts for probability calculation
    zone_counts = {
        "very_rare": 0,
        "rare": 0,
        "uncommon": 0,
        "less_common": 0,
        "common": 0
    }

    for row in range(1, 7):
        row_lines = ["" for _ in range(max_outcomes)]

        for col in range(1, 7):
            total = row + col
            zone = get_zone(total)
            zone_counts[zone] += 1

            # Assign outcomes based on the total zone
            if zone == "very_rare":
                outcomes = very_rare_outcomes
            elif zone == "rare":
                outcomes = rare_outcomes
            elif zone == "uncommon":
                outcomes = uncommon_outcomes
            elif zone == "less_common":
                outcomes = less_common_outcomes
            else:
                outcomes = common_outcomes

            # Pad to max height
            padded = outcomes + ["" for _ in range(max_outcomes - len(outcomes))]

            for i in range(max_outcomes):
                outcome = padded[i][:20]  # Trim to 20 chars
                row_lines[i] += f"| {outcome:<20} "

        for i, line in enumerate(row_lines):
            prefix = str(row) if i == 0 else " "
            print(f"{prefix:<7} {line}|")

        print(" " + "-" * (24 * 6 + 1))

    # Calculate and display probabilities
    total_cells = 36  # 6x6 grid
    print("\n=== Outcome Probabilities ===")
    for zone, count in zone_counts.items():
        probability = (count / total_cells) * 100
        outcomes = ', '.join(locals()[f"{zone}_outcomes"])
        print(f"{outcomes or 'None'}: {probability:.2f}%")


def main():
    print("""
=== Balanced Stacked Heatmap Generator ===
Outcomes are distributed by probability zone:
- Very Rare (sums 2, 12): Up to 3 outcomes
- Rare (sums 3, 11): Up to 3 outcomes
- Uncommon (sums 4, 10): Up to 3 outcomes
- Less Common (sums 5, 9): Up to 3 outcomes
- Common (sums 6-8): Up to 3 outcomes
""")

    very_rare_outcomes = get_user_input("Enter 1-3 VERY RARE outcomes (appear in sums 2, 12): ")
    rare_outcomes = get_user_input("Enter 1-3 RARE outcomes (appear in sums 3, 11): ")
    uncommon_outcomes = get_user_input("Enter 1-3 UNCOMMON outcomes (appear in sums 4, 10): ")
    less_common_outcomes = get_user_input("Enter 1-3 LESS COMMON outcomes (appear in sums 5, 9): ")
    common_outcomes = get_user_input("Enter 1-3 COMMON outcomes (appear in sums 6-8): ")

    generate_table(very_rare_outcomes, rare_outcomes, uncommon_outcomes, less_common_outcomes, common_outcomes)


if __name__ == "__main__":
    main()
And that’s it for this week. I’m late getting this out, but wanted it to be less of a jumbled mess than last weeks post. You know, quality over quantity. I hope you find this useful; it’s just something I started exploring and while it’s kind of a rehashing of what I’ve already covered, it’s a new form. And form is always quite important, don’t you think?
See you all next week, please take care of yourselves and one antoher. We’re all we’ve got. See you next week with… who knows what. Appreciate you.
Celestial Bodies is my favorite TTRPG that plays on a 2d6 grid. You build your mech on the grid and roll 2d6 to see where on the grid you hit your opponents. It adds such a fun layer to character creation when considering the bell curve.
Good lord this made my head spin!!! In a good way, and I’m still somewhat clueless about what you wrote. I’m def impressed! 😊